-
class diagram:-
a class diagram in the Unified Modeling Language (UML) is a type of static structure diagram that describes the structure of a system by showing the system’s classes, their attributes, operations (or methods), and the relationships among objects.
- Attribute
An attribute of a class represents a characteristic of a class that is of interest for the user of the IT system:
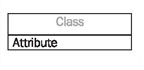
Characteristics of interest of a passenger, for example, are name and age.
- Generalization
Generalization is a relationship between two classes: a general class and a special class:

- Association
An association represents a relationship between two classes:
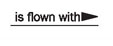
An association indicates that objects of one class have a relationship with objects of another class, in which this connection has a specifically defined meaning (for example, “is flown with”).
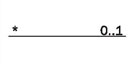
- Multiplicity
A multiplicity allows for statements about the number of objects that are involved in an association:
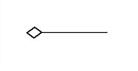
- Aggregation
An aggregation is a special case of an association (see above) meaning “consists of”:
Example:-

2 .USE CASE DIAGRAM:–
The purpose of a use case diagram in UML is to demonstrate the different ways that a user might interact with a system. Create a professional diagram for nearly any use case using our UML diagram tool.
- Use Case:

A use case diagram is a dynamic or behavior diagram in UML. Use case diagrams model the functionality of a system using actors and use cases. Use cases are a set of actions, services, and functions that the system needs to perform. In this context, a “system” is something being developed or operated, such as a web site. The “actors” are people or entities operating under defined roles within the system
- Association:-
Actor and use case can be associated to indicate that the actor participates in that use case. Therefore, an association correspond to a sequence of actions between the actor and use case in achieving the use case.
-
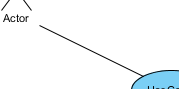
Actor:-
![]()
Actors are the entities that interact with a system. Although in most cases, actors are used to represent the users of system, actors can actually be anything that needs to exchange information with the system. So, an actor may be people, computer hardware, other systems, etc.
Note that actor represents a role that a user can play but not a specific user. So, in a hospital information system, you may have doctor and patient as actors but not Dr. John, Mrs. Brown as actors.
-
System
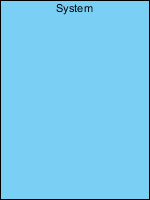
The scope of a system can be represented by a system (shape), or sometimes known as a system boundary. The use cases of the system are placed inside the system shape, while the actor who interact with the system are put outside the system. The use cases in the system make up the total requirements of the system
-
Dependency
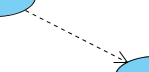
A dependency relationship represents that a model element relies on another model element for specification and/or implementation.
3. DATA FLOW DIAGRAM:–
A data flow diagram (DFD) is a graphical representation of the “flow” of data through an information system, modelling its process aspects. A DFD is often used as a preliminary step to create an overview of the system without going into great detail, which can later be elaborated. DFDs can also be used for the visualization of data processing (structured design).
-
Process Notation
A process transforms incoming data flow into outgoing data flow.

-
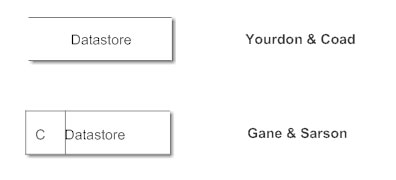
Data store Notations
Data stores are repositories of data in the system. They are sometimes also referred to as files.
-
Data flow Notations
Data flows are pipelines through which packets of information flow. Label the arrows with the name of the data that moves through it.

-
External Entity Notations
External entities are objects outside the system, with which the system communicates. External entities are sources and destinations of the system’s inputs and outputs.
Example:-


-
ACTIVITY DIAGRAM:-
Activity diagram is another important diagram in UML to describe the dynamic aspects of the system.
Activity diagram is basically a flowchart to represent the flow from one activity to another activity. The activity can be described as an operation of the system.
The control flow is drawn from one operation to another. This flow can be sequential, branched, or concurrent. Activity diagrams deal with all type of flow control by using different elements such as fork, join, etc
- Initial State or Start Point
A small filled circle followed by an arrow represents the initial action state or the start point for any activity diagram. For activity diagram using swimlanes, make sure the start point is placed in the top left corner of the first column.

- Activity or Action State
An action state represents the non-interruptible action of objects. You can draw an action state in SmartDraw using a rectangle with rounded corners.

-
Action Flow
Action flows, also called edges and paths, illustrate the transitions from one action state to another. They are usually drawn with an arrowed line.

- Object Flow
Object flow refers to the creation and modification of objects by activities. An object flow arrow from an action to an object means that the action creates or influences the object. An object flow arrow from an object to an action indicates that the action state uses the object.

- Decisions and Branching
A diamond represents a decision with alternate paths. When an activity requires a decision prior to moving on to the next activity, add a diamond between the two activities. The outgoing alternates should be labeled with a condition or guard expression. You can also label one of the paths “else.”

- Synchronization
A fork node is used to split a single incoming flow into multiple concurrent flows. It is represented as a straight, slightly thicker line in an activity diagram.
A join node joins multiple concurrent flows back into a single outgoing flow.
A fork and join mode used together are often referred to as synchronization.

Example:-

5. SEQUENCE DIAGRAM:-
Sequence diagrams are a popular dynamic modeling solution in UML because they specifically focus on lifelines, or the processes and objects that live simultaneously, and the messages exchanged between them to perform a function before the lifeline ends. Along with our UML diagramming tool, use this guide to learn everything there is to know about sequence diagrams in UML.
- Class Roles or Participants
Class roles describe the way an object will behave in context. Use the UML object symbol to illustrate class roles, but don’t list object attributes.

- Activation or Execution Occurrence
Activation boxes represent the time an object needs to complete a task. When an object is busy executing a process or waiting for a reply message, use a thin gray rectangle placed vertically on its lifeline.

- Messages
Messages are arrows that represent communication between objects. Use half-arrowed lines to represent asynchronous messages. Asynchronous messages are sent from an object that will not wait for a response from the receiver before continuing its tasks. For message types, see below.

- Lifelines
Lifelines are vertical dashed lines that indicate the object’s presence over time.

Types of Messages in Sequence Diagrams
- Synchronous Message
A synchronous message requires a response before the interaction can continue. It’s usually drawn using a line with a solid arrowhead pointing from one object to another.

- Asynchronous Message
Asynchronous messages don’t need a reply for interaction to continue. Like synchronous messages, they are drawn with an arrow connecting two lifelines; however, the arrowhead is usually open and there’s no return message depict
- Reply or Return Message
A reply message is drawn with a dotted line and an open arrowhead pointing back to the original lifeline.

- Self Message
A message an object sends to itself, usually shown as a U shaped arrow pointing back to itself.

- Create Message
This is a message that creates a new object. Similar to a return message, it’s depicted with a dashed line and an open arrowhead that points to the rectangle representing the object created.

- Delete Message
This is a message that destroys an object. It can be shown by an arrow with an x at the end.

- Lost Message
A message sent to an unknown recipient. It’s shown by an arrow going from a lifeline to an endpoint, a filled circle or an x.

Example:

-
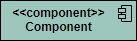
Component
A component is drawn as a rectangle with optional compartments stacked vertically. A component can be represented as just a rectangle with the component’s name and the component stereotype text and/or icon. The component stereotype’s text is “<<component>>” and the component stereotype icon is a rectangle with two smaller rectangles protruding on its left side.
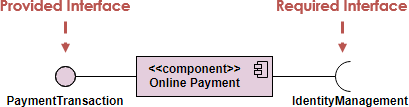
Component Interfaces
Provide Interface
Provided interfaces define “a set of public attributes and operations that must be provided by the classes that implement a given interface”.
Required Interface
Required interfaces define “a set of public attributes and operations that are required by the classes that depend upon a given interface”.
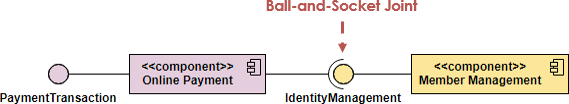
Component Assemblies
Components can be “wired” together using to form subsystems, with the use of a ball-and-socket joint.
Port
A port (definition) indicates that the component itself does not provide the required interfaces (e.g., required or provided). Instead, the component delegates the interface(s) to an internal class.
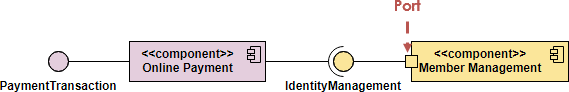
Diagram:-

- DEPLOYMENT DIAGRAM:-
Nodes

There are two types of nodes in a deployment diagram: device nodes and execution environment nodes. Device nodes are computing resources with processing capabilities and the ability to execute programs. Some examples of device nodes include PCs, laptops, and mobile phones.
An execution environment node, or EEN, is any computer system that resides within a device node. It could be an operating system, a JVM, or another servlet container.
Database
Databases represent any data stored by the deployed system. In some instances, you’ll see a database represented as just another node, but sometimes you will see this shape as a database.
Diagram:-

